First Steps with SynSatiPy
Here, we show:
how to load synsatipy within a notebook
how to initialize a synsat class
how to run synsat on idealized profile (test data)
Setup Env and Load Libraries
[1]:
import os, sys
os.environ['RTTOV_PYTHON_WRAPPER'] = '/work/bb1262/tools/rttov/rttov-v13.2/wrapper'
[2]:
import synsatipy

from synsatipy.synsat import SynSat

from synsatipy.tests.synsat_test import SynSatTest
[3]:
import pylab as plt
Run a SynSat Calculation with Example Data
Initialize SynSatTest and Input Test Data
The default instrument used in SynSatiPy is “MSG SEVIRI”.
[4]:
synsat_test = SynSatTest()
... [synsat] set cloud / aerosol file to  /work/bb1262/tools/rttov/rttov-v13.2/rtcoef_rttov13/cldaer_visir/sccldcoef_msg_3_seviri.dat
... [synsat] load coefficient file /work/bb1262/tools/rttov/rttov-v13.2/rtcoef_rttov13/rttov13pred54L/rtcoef_msg_3_seviri_o3.dat
... [synsat] example data loaded
 2025/05/07  07:57:01  Load coefficients:
 2025/05/07  07:57:01  /work/bb1262/tools/rttov/rttov-v13.2/rtcoef_rttov13/rttov13pred54L/rtcoef_msg_3_seviri_o3.dat
Load successful >>>>> inst_id : 1, nchannels : 6.
 2025/05/07  07:57:01  /work/bb1262/tools/rttov/rttov-v13.2/rtcoef_rttov13/cldaer_visir/sccldcoef_msg_3_seviri.dat
Example Data are Simple Profiles
Example data have been just prescribed as simple profiles that are gathered within the synsat_test.Profiles class (inherited from pyrttov)
[5]:
fig, axs = plt.subplots( ncols = 2, figsize = (8,8), sharey = True)
nprof = synsat_test.Profiles.Nprofiles

for iprof in range( nprof ):
    p = synsat_test.Profiles.P[iprof]
    T = synsat_test.Profiles.T[iprof]
    q = synsat_test.Profiles.Q[iprof]

    axs[0].plot(T,p)

    axs[1].plot(q,p)

axs[0].set_ylim(1000,100)
axs[0].set_ylabel('pressure / hPa')
axs[0].set_xlabel('temperature / K')
axs[1].set_xlabel('specific humidity / ppmv')
[5]:
Text(0.5, 0, 'specific humidity / ppmv')

Running SynSatiPy
[6]:
synsat_test.run_workflow()
IR emissivity atlas loaded successfully
Atlas deallocated.
 2025/05/07  07:57:02  Running RTTOV using nthreads =    1 and nprofs_per_call =        1
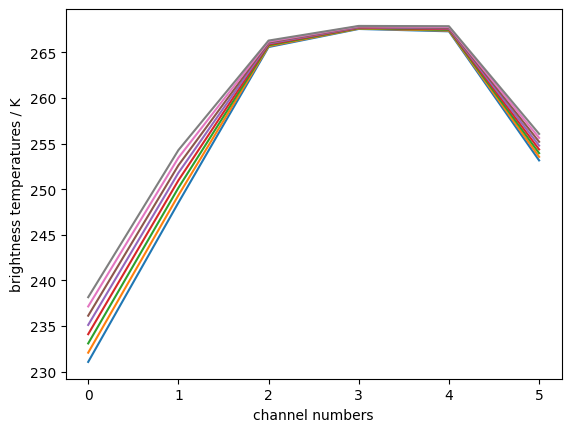
Plot the Output
The attribute synsat_test.BtRefl is holding the output vars.
[7]:
bts = synsat_test.BtRefl
[8]:
for iprof in range( nprof ):
    plt.plot( bts[iprof] )

plt.xlabel( 'channel numbers' )
plt.ylabel( 'brightness temperatures / K' )
[8]:
Text(0, 0.5, 'brightness temperatures / K')
Initialize Synsat Class for a Particular Instrument
for MSG SEVIRI
[9]:
synsat_seviri = SynSat( synsat_instrument = 'SEVIRI' )
... [synsat] set cloud / aerosol file to  /work/bb1262/tools/rttov/rttov-v13.2/rtcoef_rttov13/cldaer_visir/sccldcoef_msg_3_seviri.dat
... [synsat] load coefficient file /work/bb1262/tools/rttov/rttov-v13.2/rtcoef_rttov13/rttov13pred54L/rtcoef_msg_3_seviri_o3.dat
Load successful >>>>> inst_id : 2, nchannels : 6.
 2025/05/07  07:57:02  Load coefficients:
 2025/05/07  07:57:02  /work/bb1262/tools/rttov/rttov-v13.2/rtcoef_rttov13/rttov13pred54L/rtcoef_msg_3_seviri_o3.dat
 2025/05/07  07:57:02  /work/bb1262/tools/rttov/rttov-v13.2/rtcoef_rttov13/cldaer_visir/sccldcoef_msg_3_seviri.dat
for GOES ABI
[10]:
synsat_abi = SynSat( synsat_instrument = 'ABI' )
... [synsat] set cloud / aerosol file to /work/bb1262/tools/rttov/rttov-v13.2/rtcoef_rttov13/cldaer_visir/sccldcoef_goes_16_abi.dat
... [synsat] load coefficient file /work/bb1262/tools/rttov/rttov-v13.2/rtcoef_rttov13/rttov13pred54L/rtcoef_goes_16_abi_o3.dat
 2025/05/07  07:57:02  Load coefficients:
 2025/05/07  07:57:02  /work/bb1262/tools/rttov/rttov-v13.2/rtcoef_rttov13/rttov13pred54L/rtcoef_goes_16_abi_o3.dat
Load successful >>>>> inst_id : 3, nchannels : 10.
 2025/05/07  07:57:02  /work/bb1262/tools/rttov/rttov-v13.2/rtcoef_rttov13/cldaer_visir/sccldcoef_goes_16_abi.dat